Overview
SBV partnered with Tiltshift to drive a digital transformation in response to the rise of digital payments and COVID-19. The goal was to evolve its service model and deliver a more engaging, digitised customer experience through a unified portal.
Year: 2021
Industry: Financial Services
Client: SBV
Project: SBV connect
Role: Senior User Experience Designer
Design Features
Key features of the SBV Connect project
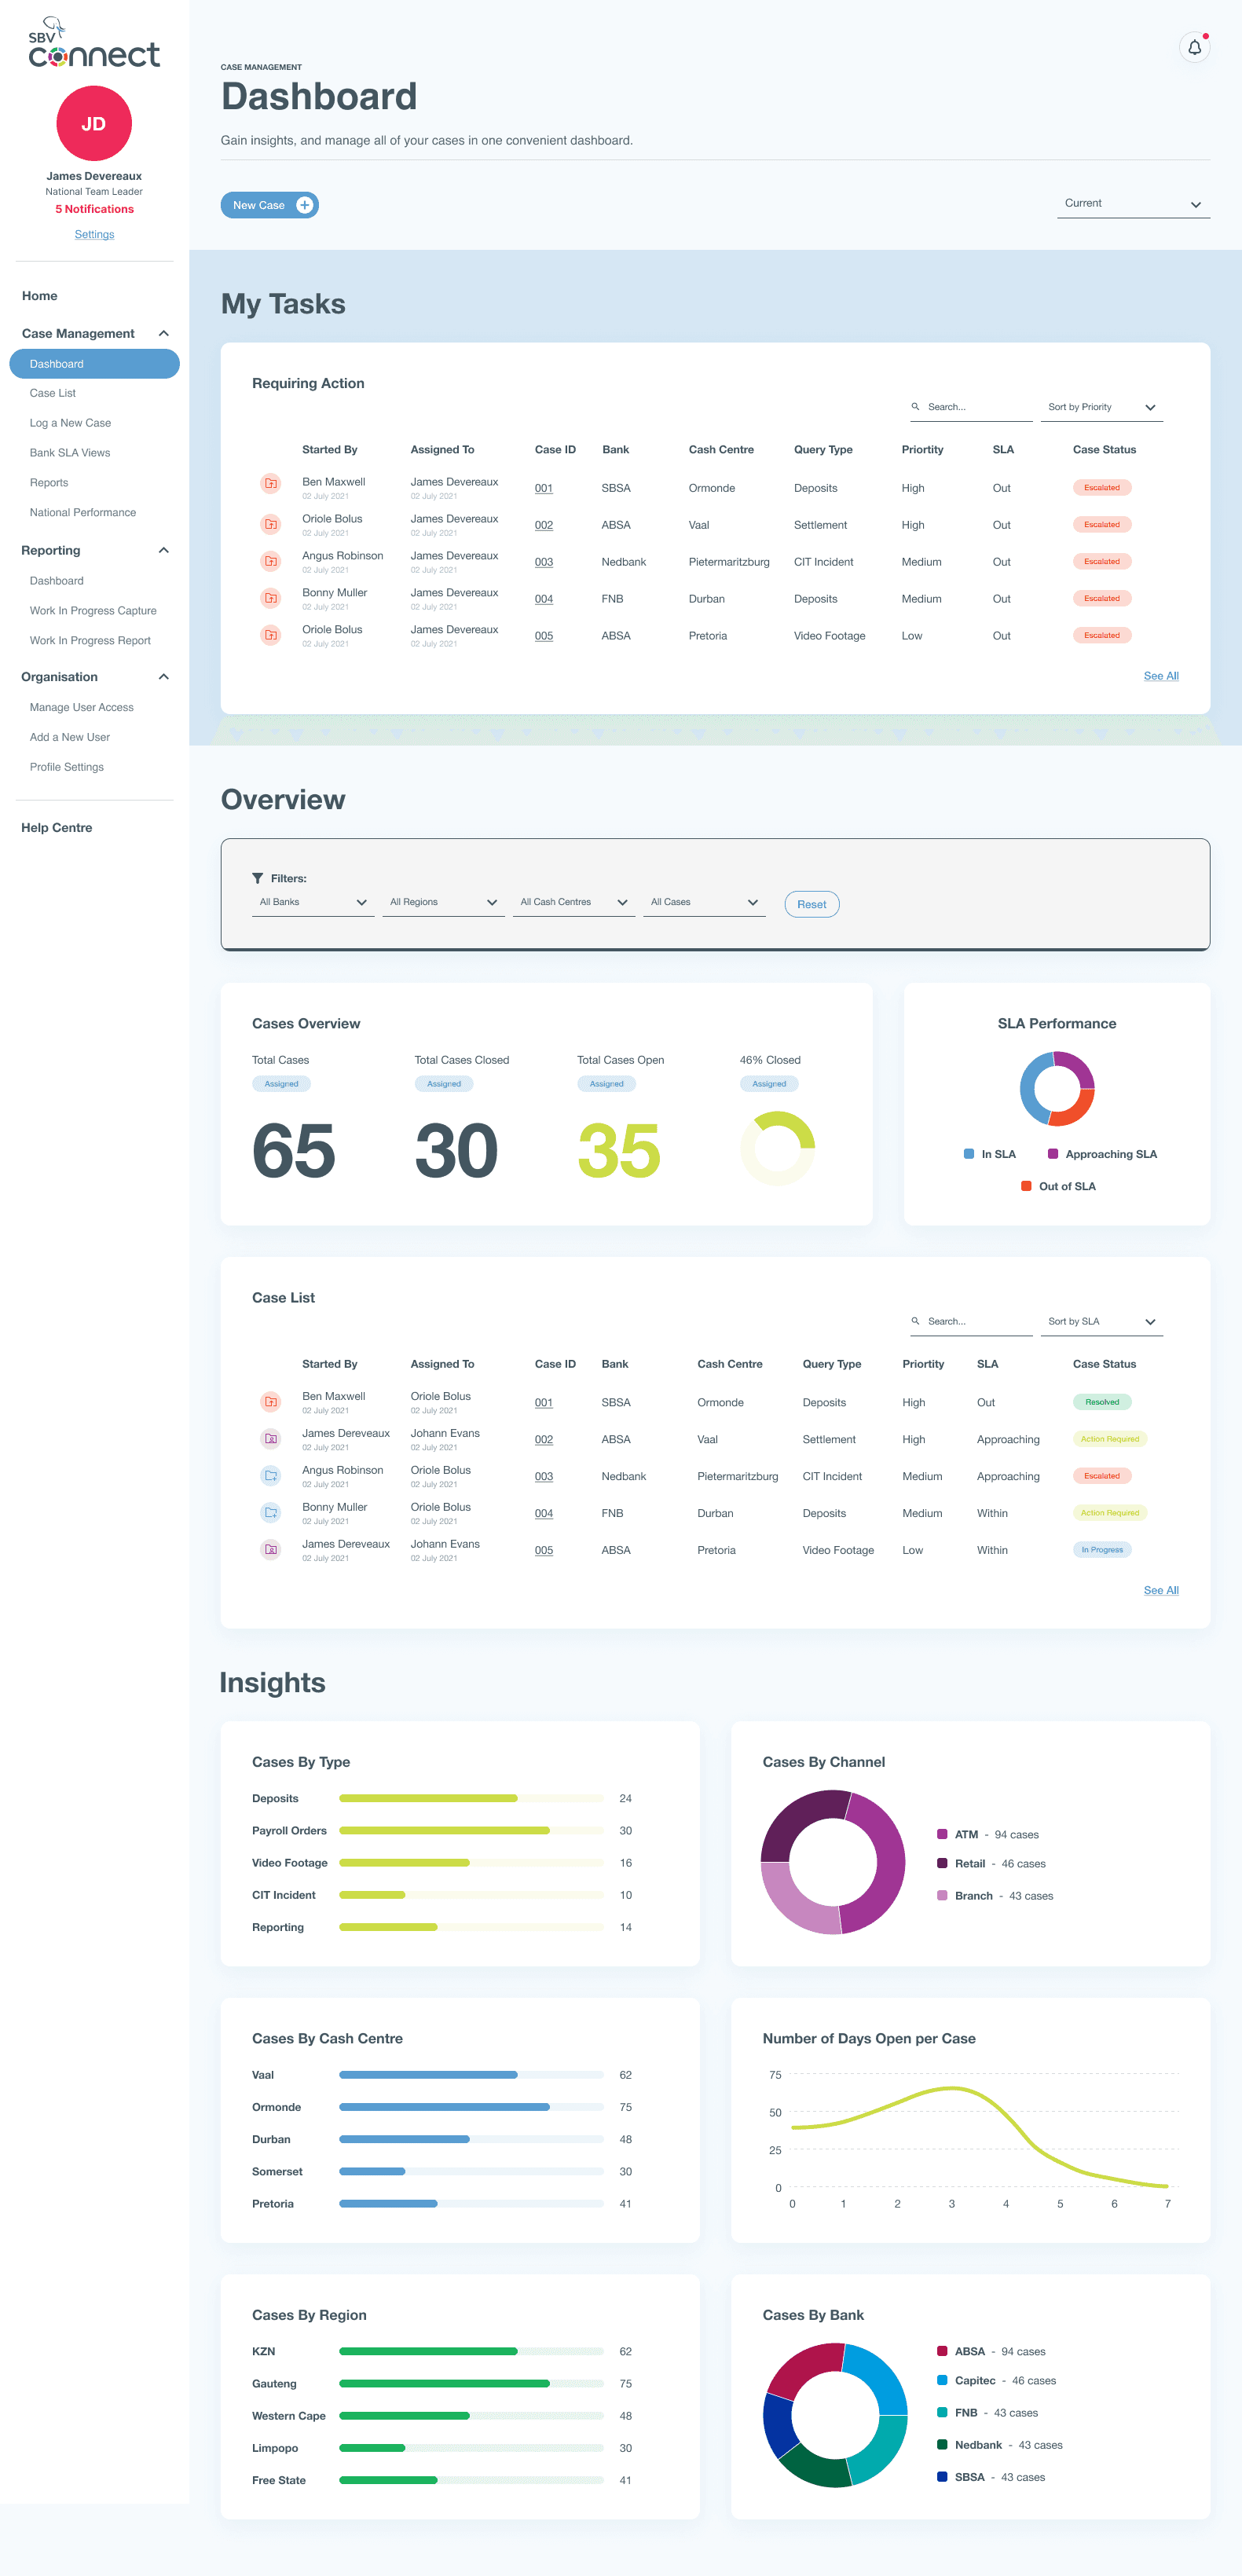
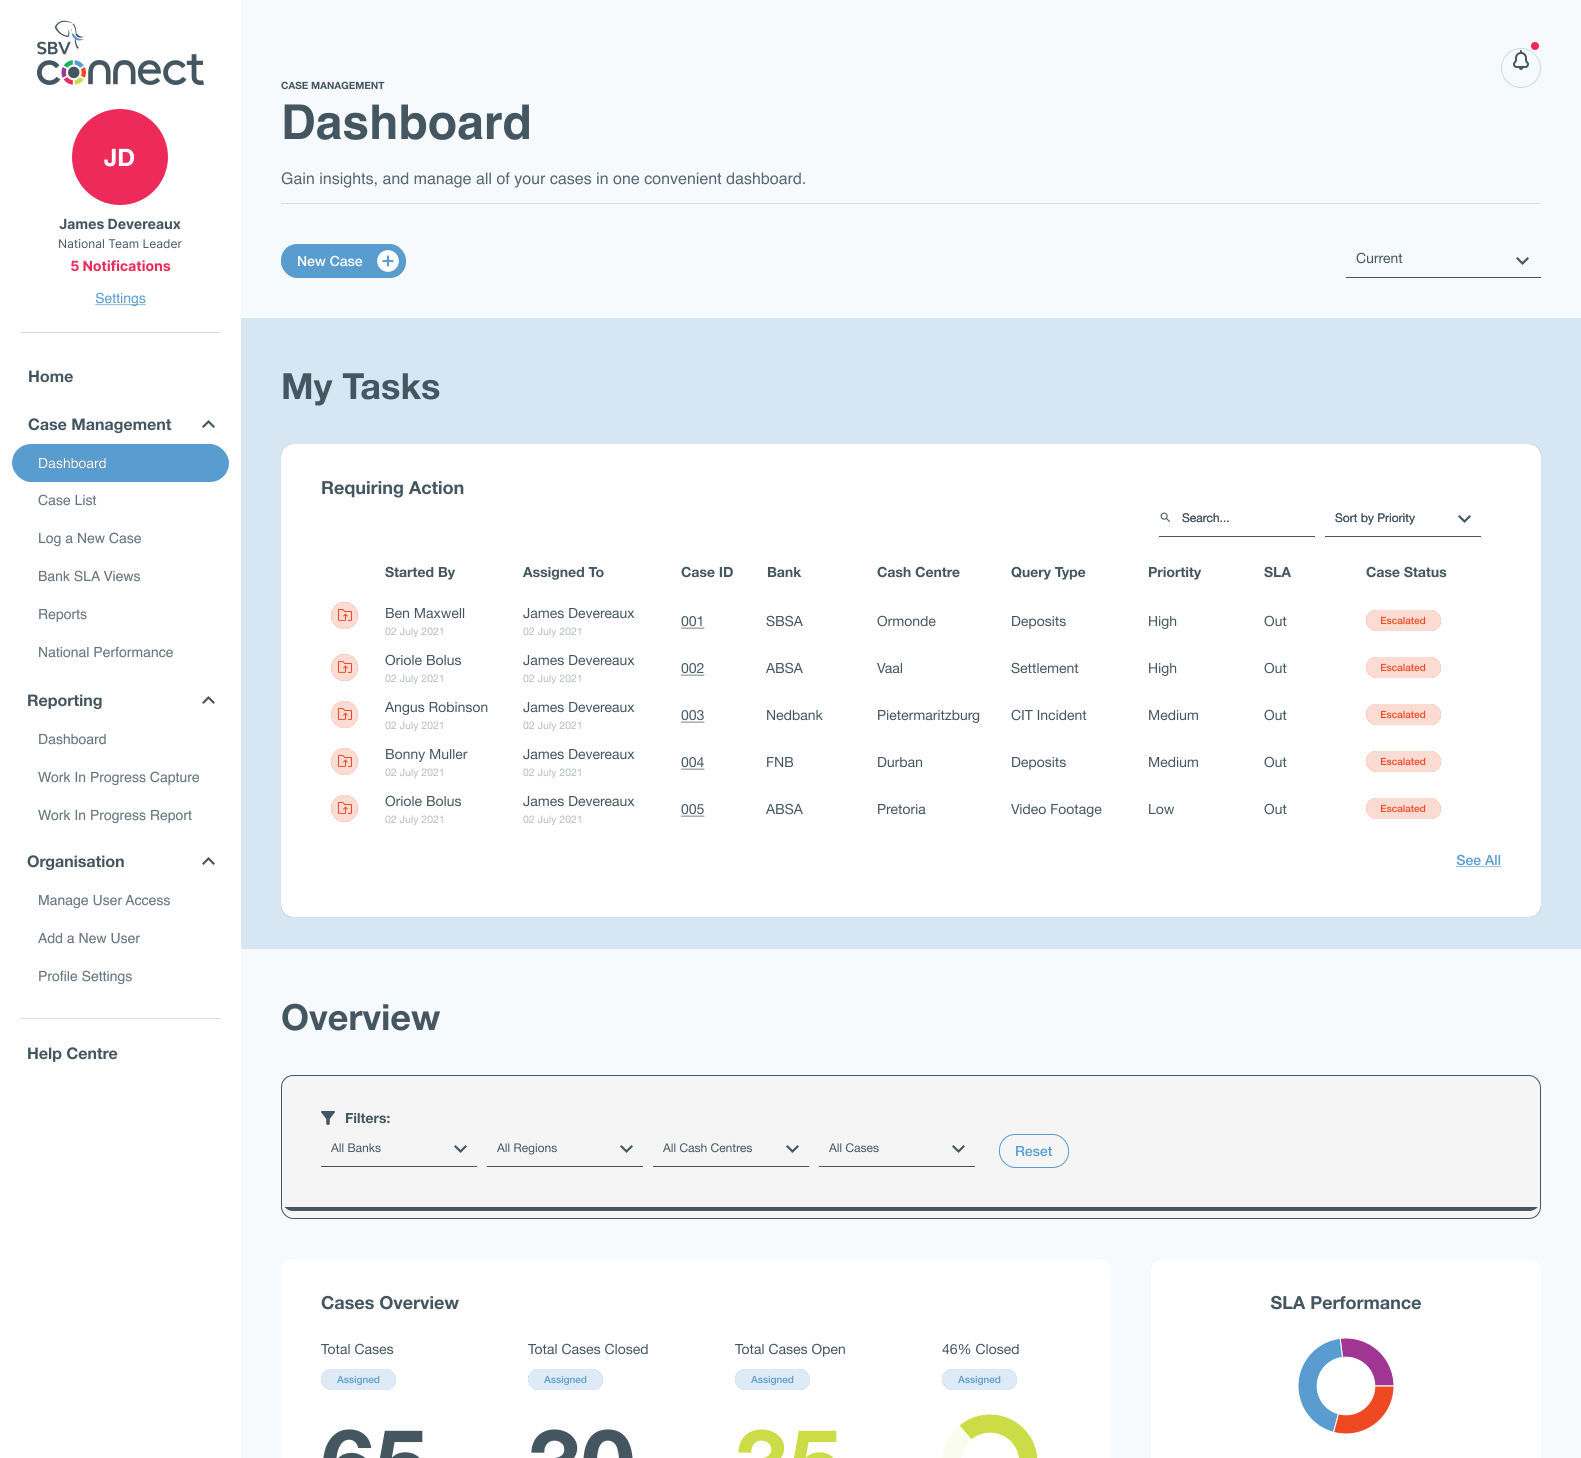
Dashboard
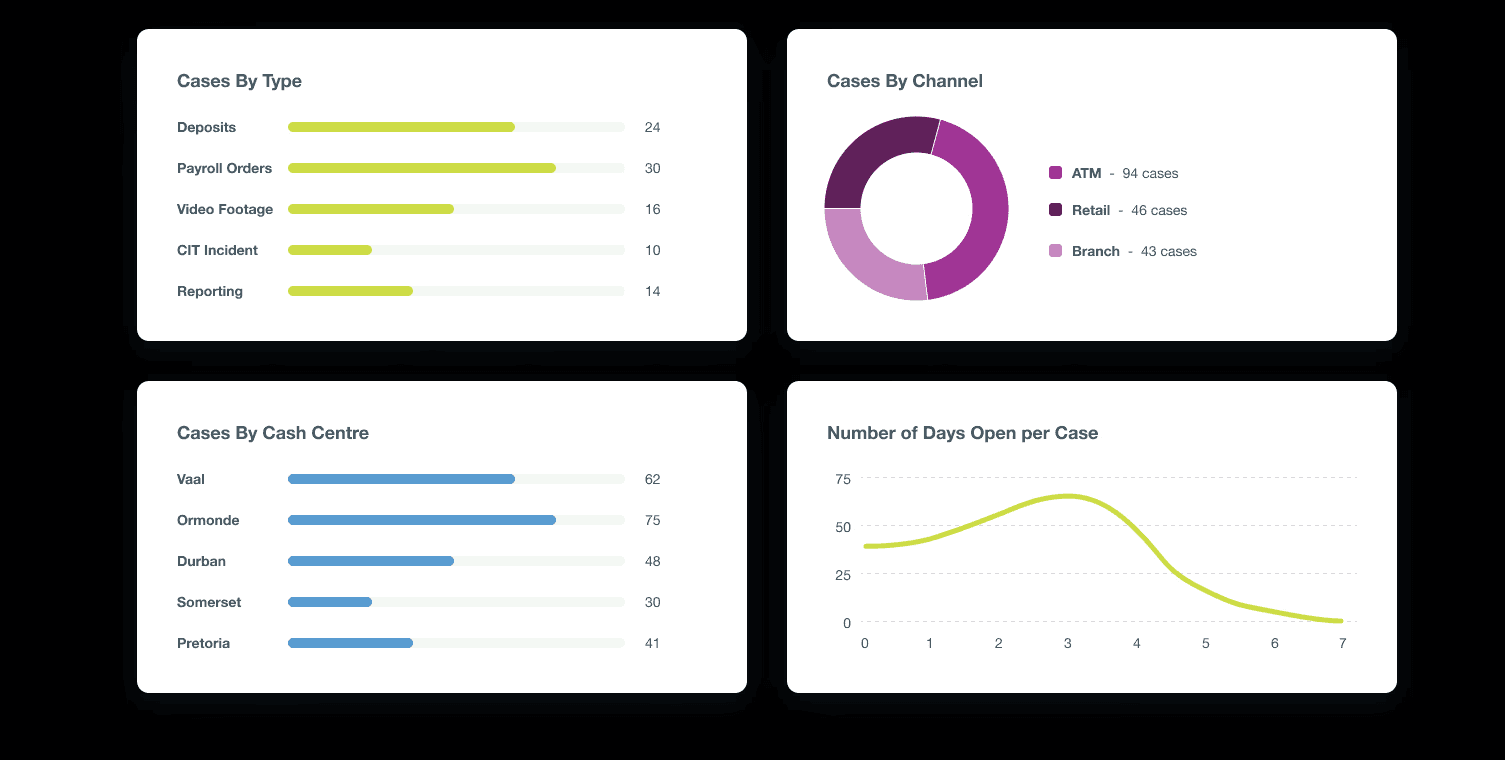
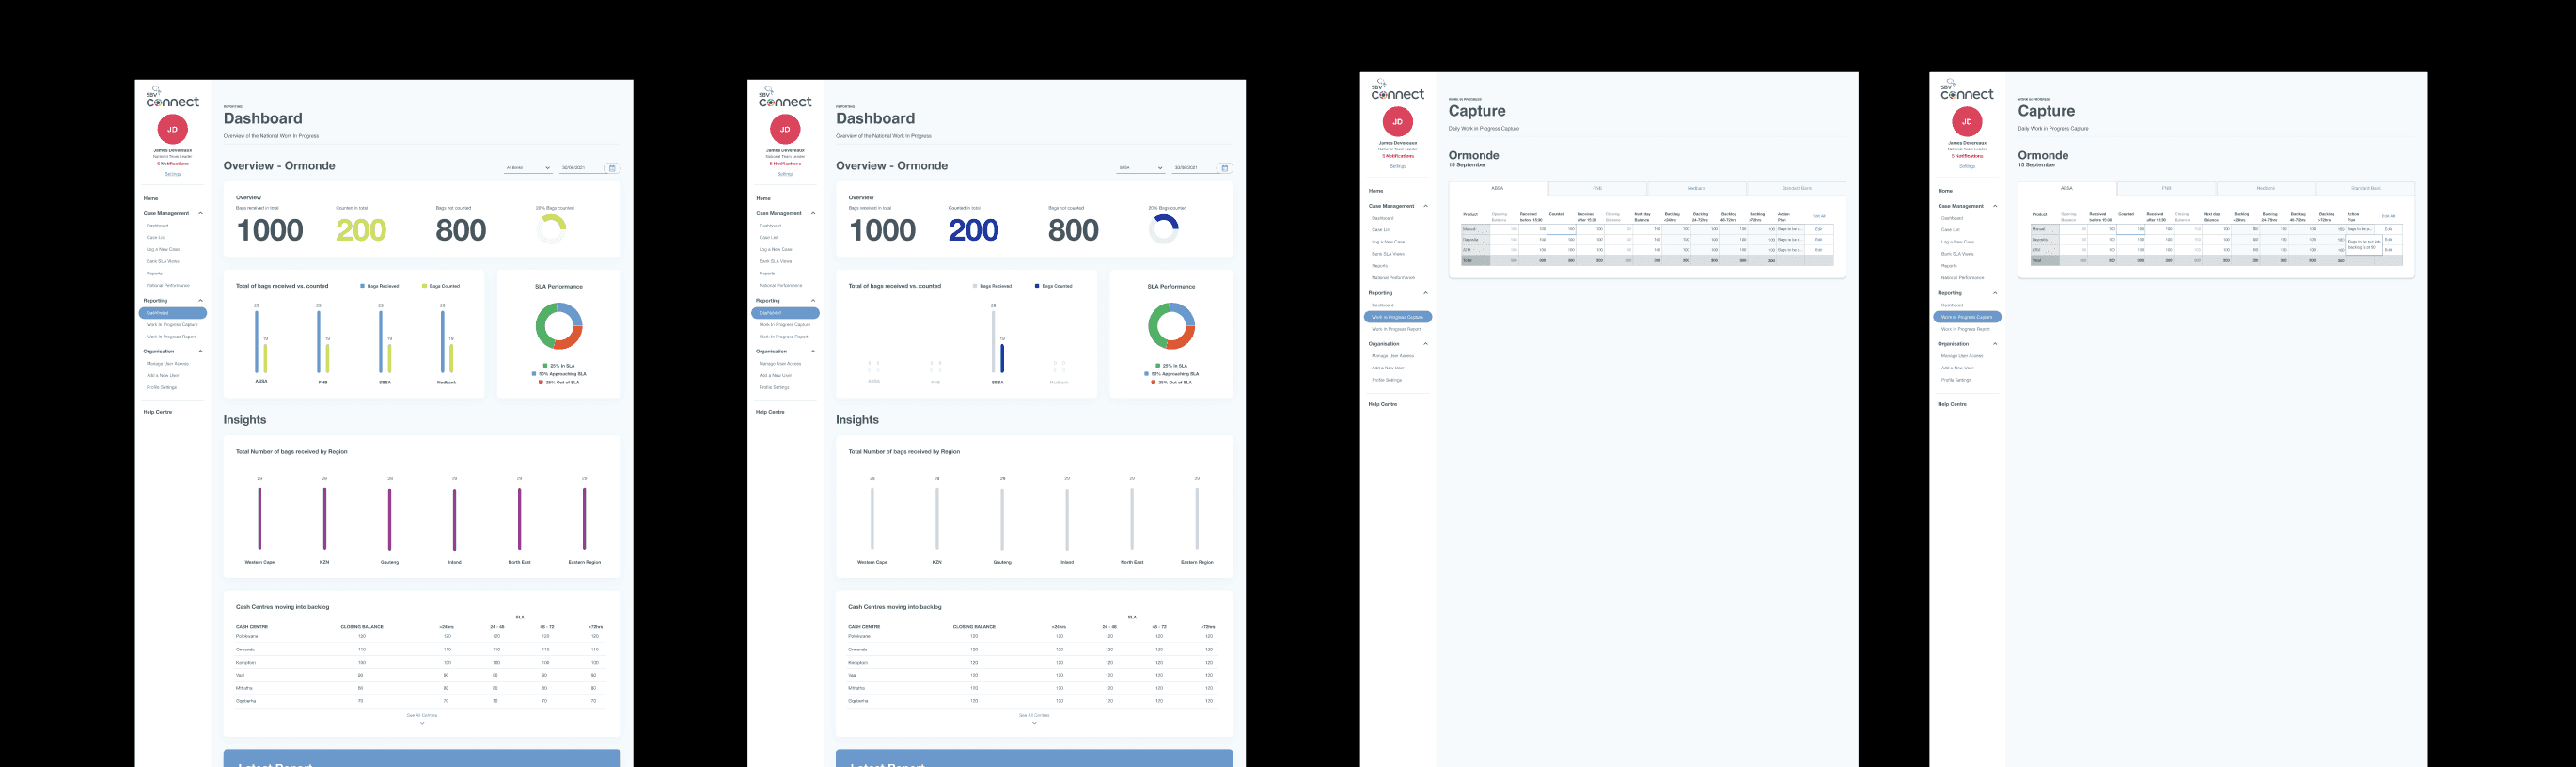
A comprehensive dashboard to manage various clients and data, providing users with a centralized view for efficient management.
New Scalable Design System
A design system that defines the brand and creates scalable components, ensuring consistency across the platform while allowing for growth.
Mobile Responsive Design
Designed to be mobile-friendly, ensuring users can access the platform seamlessly across different devices and contexts.
Business Process Modeling
Developed a setup to respond to key business processes and capture data projections, enabling efficient operations and informed decision-making.
SBV embarked on a significant journey to digitise its operations and achieve digital transformation, discovering that this transition was more substantial than anticipated. We acknowledged this challenge and communicated to SBV, who were new to digital transformation, that the process can be gradual and requires a crucial mindset shift as the company aligns its pace with new digital solutions.
Approach
Working with large product teams, both from the agency and the client, agile methodologies were essential for delivering in a rapid and iterative manner.
Overview
Navigating digital transformation, we adopted an agile approach focused on collaboration, flexibility, and continuous improvement, helping SBV deliver impactful solutions aligned to evolving business needs.
Tools
Figma, Figma, Miro, Jira, Slack
Rituals
Daily standups Retro's Design reviews
Business Requirement Workshops
User Interviews
Synthesis
Customer Journeys and To-Be Journeys
Task Flows & Jobs to Be Done
Information Architecture
Wireframes & Wireflows
Dashboards
UI
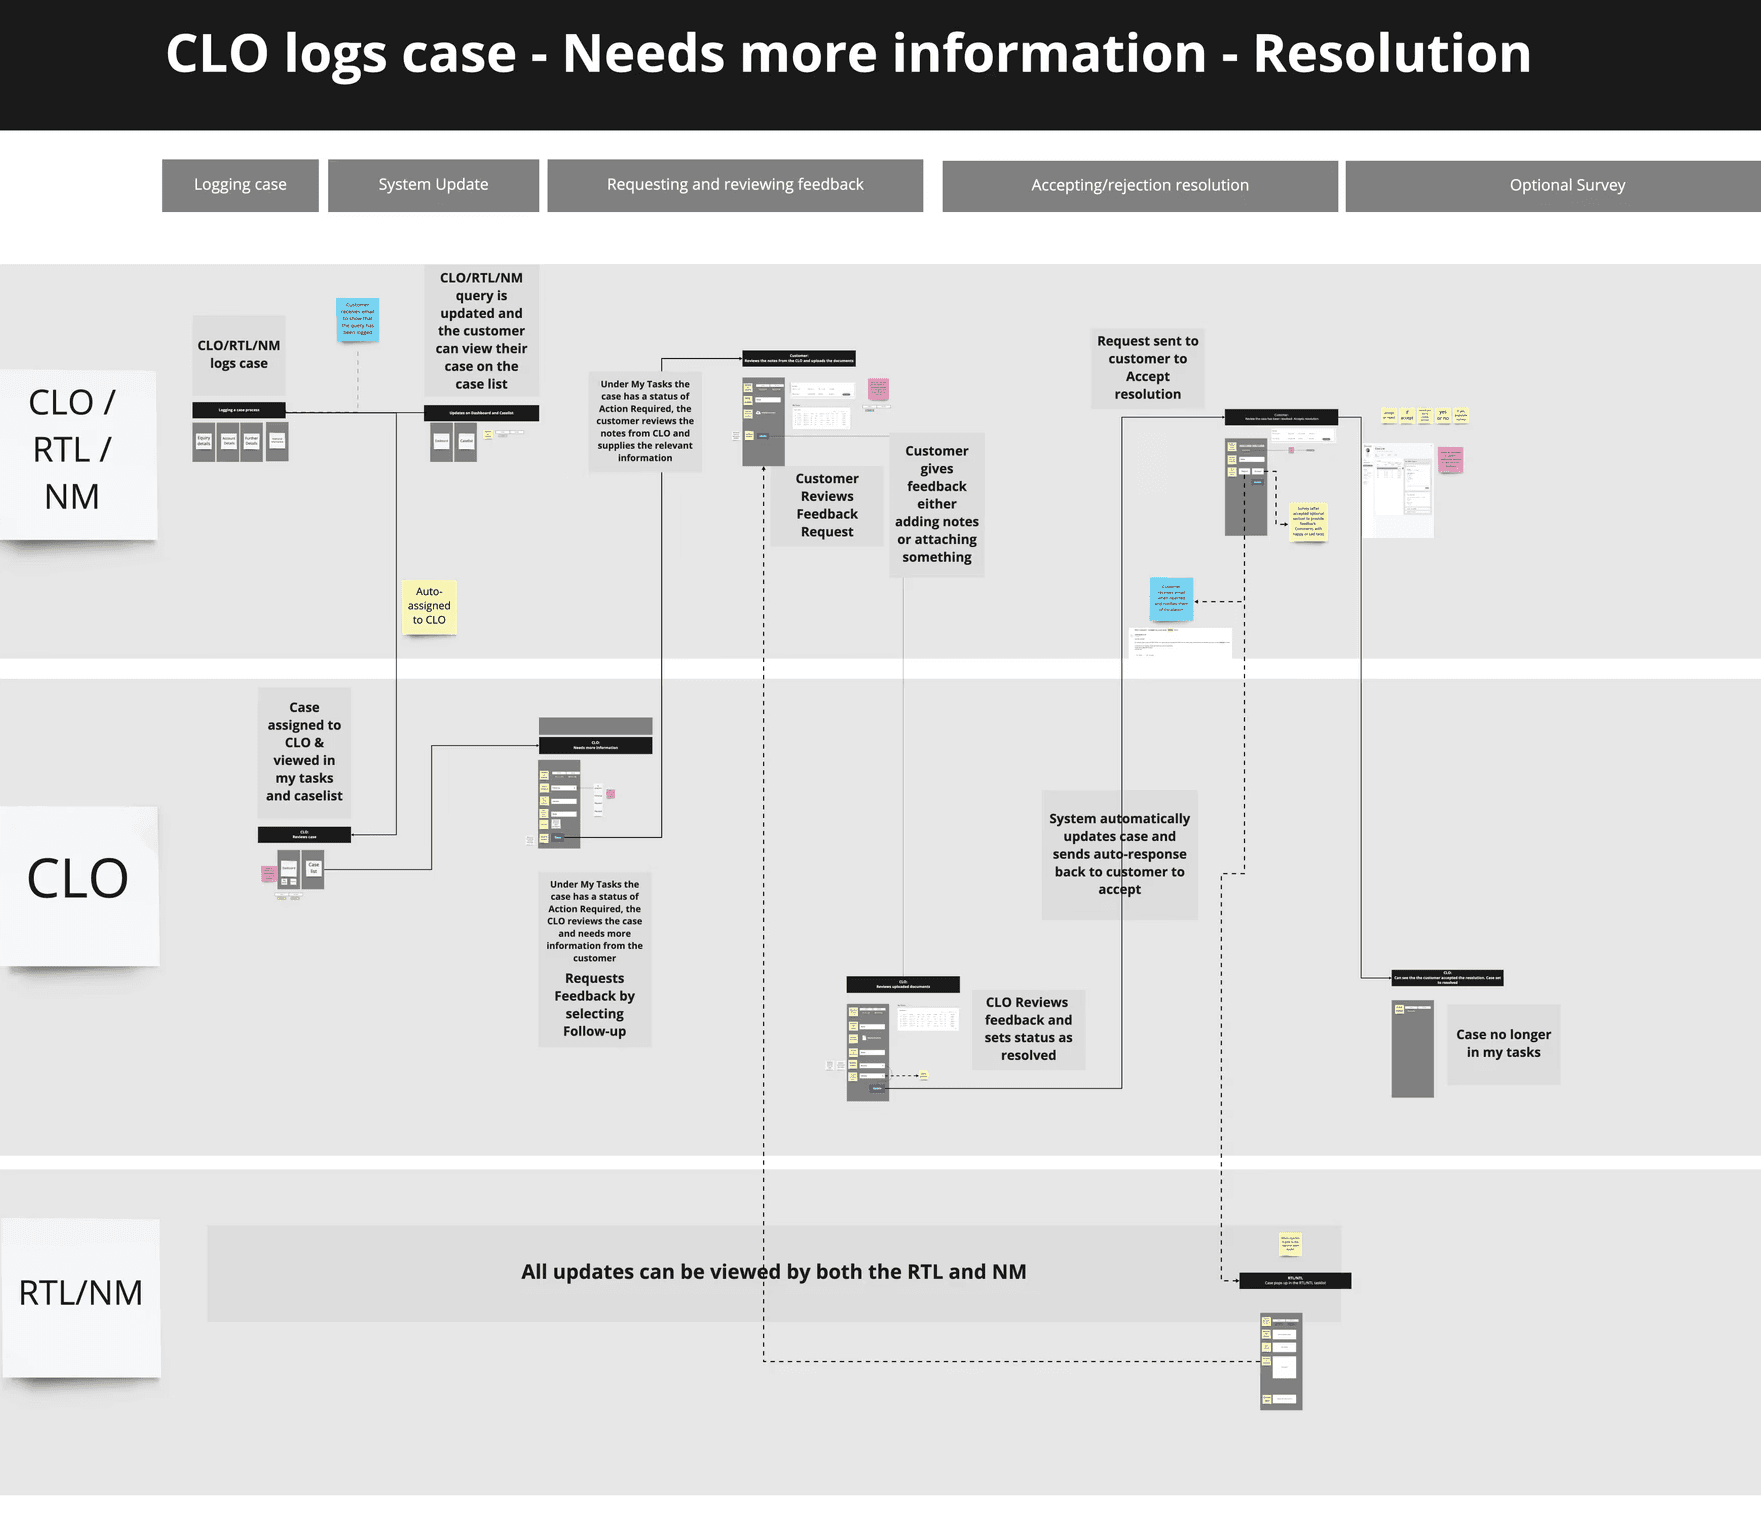
Complex workflows were designed to define different user roles and permissions across the system.
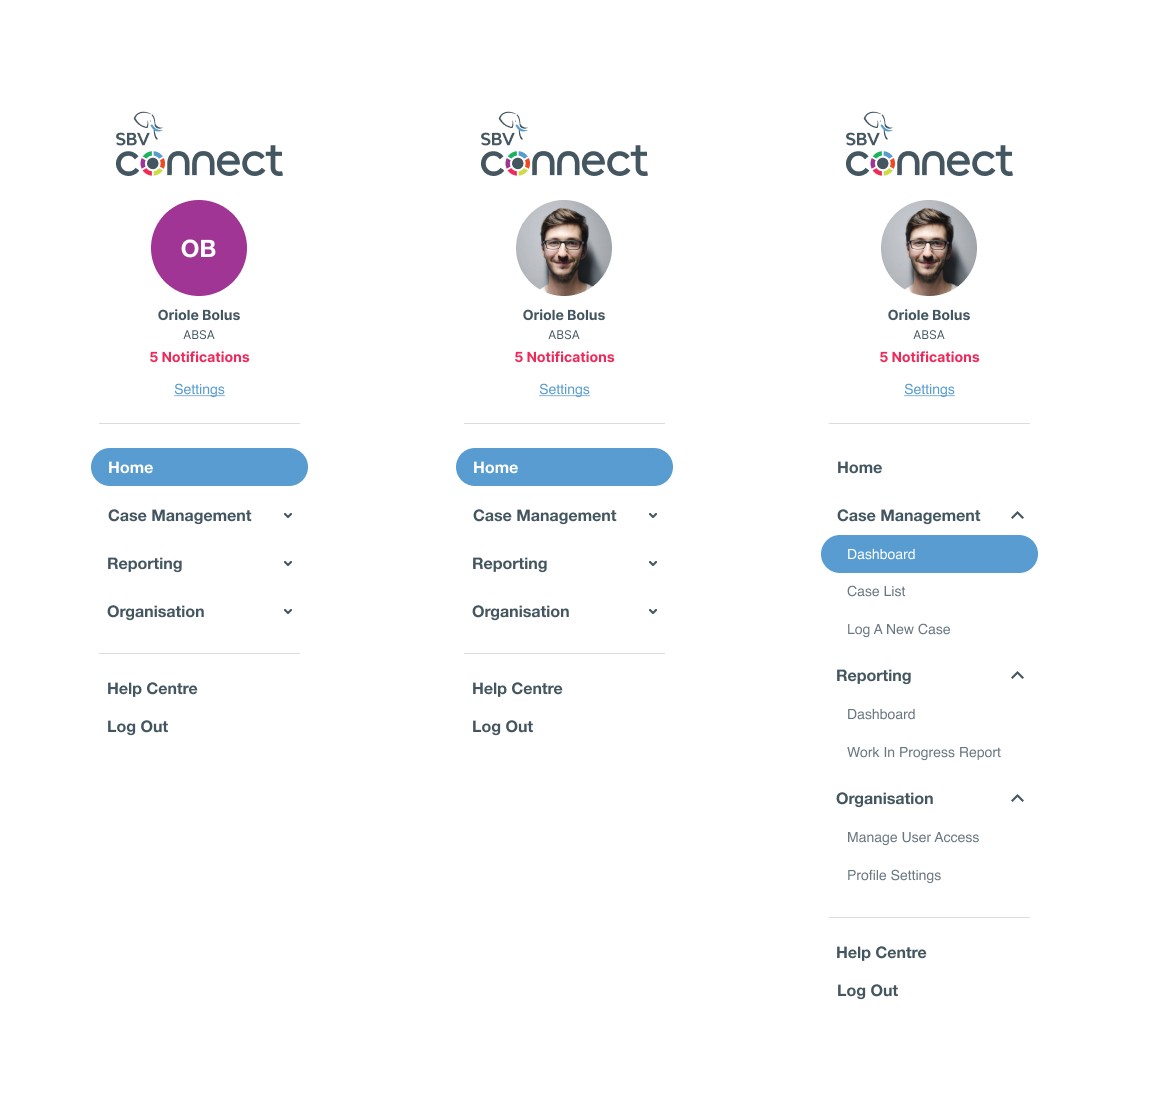
A Material Design system was established to set the direction for scalable and consistent UI components.
UX design and component structures were developed to present data analytics and support visibility into business operations.

API integrations